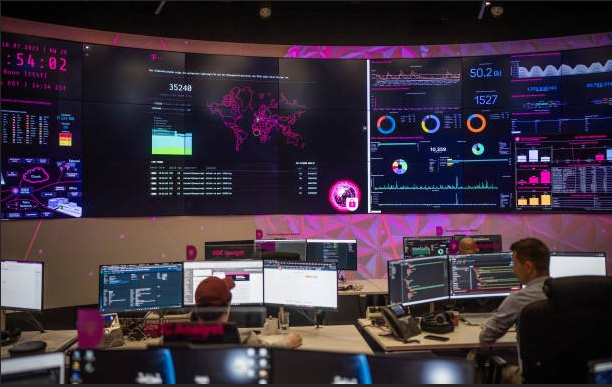
Your monitoring dashboard lights up at 2:13 a.m. Is it a real outage, a harmless traffic spike, or another warning that will disappear before anyone checks it? For Iraq IT teams supporting banks, hospitals, retailers, and growing digital businesses, that uncertainty drains time and attention. A network monitoring alert should guide your next move rather than sending you to disconnected dashboards. Recent security research shows why teams need fewer low-value warnings and clearer context. These five findings can help you reduce noise while keeping genuine service and security risks visible.
Key Takeaways
- Measure action, not volume: A large alert queue means little when your team cannot investigate it.
- Prioritize business impact: Customer access and essential services should determine which warnings come first.
- Build connected incident views: Related events are easier to understand when they appear in one clear sequence.
5 Alert Fatigue Survey Findings Iraq IT Teams Should Act On
Alert Volume Hides Risk
When hundreds of notifications compete for attention, a dangerous event can look like just another flashing icon. A network monitoring alert should tell you what changed, which asset is involved, and whether immediate action is required. Without that context, you spend valuable time deciding whether the warning deserves investigation.
That pressure is why alert volume should never be treated as proof of strong coverage. According to a SANS analysis, many security operations teams cannot keep pace with their workload. For your team, the practical move is to track how many alerts are reviewed, escalated, dismissed, and connected to confirmed incidents. Those figures show whether monitoring supports decisions or keeps everyone busy.
Business Impact Sets Priority
A red “critical” label offers little guidance when every device receives the same treatment. You need to know whether an event affects an unused access point or a service supporting customer transactions. Technical severity is only useful when paired with user impact, service dependency, location, and recovery options.
This is where business context changes the picture. The SANS SOC Metrics Cheat Sheet recommends linking security metrics to organizational goals rather than relying solely on technical activity. In practice, your alert rules should reflect what keeps the business running. Well-structured IT management can support that approach by linking systems to owners and service priorities, helping you separate urgent issues from those that belong in a scheduled queue.
Clear Ownership Prevents Drift
Nothing slows a response faster than an issue sitting in a shared queue with no named owner. Define who receives each alert category, who steps in when the first responder is unavailable, and how long the team has before escalation. A network monitoring alert should arrive with responsibility established, not trigger a debate about who handles it.
You can measure this problem directly through your own records. Review how long alerts remain untouched, how often tickets move between teams, and how many are reopened because the assignment was unclear. A short responsibility matrix can separate networking, security, application, and cloud duties. Add a compact runbook for each high-priority category so you can complete essential checks before passing the issue onward.
Local Baselines Cut Noise
Generic thresholds rarely match how your organization actually operates. Iraq businesses may see different traffic during Ramadan schedules, overnight backups, regional campaigns, or high-demand customer hours. A fixed threshold can mistake normal local behavior for trouble and repeatedly interrupt your staff, even when no service is at risk.
Your cloud infrastructure needs baselines shaped around real usage patterns, including office traffic, authentication activity, backup windows, and customer-facing applications. Review those patterns by time, location, and workload rather than relying on a single global setting. For example, an increase in traffic during a planned backup window may be normal, whereas the same increase during a quiet period warrants attention. Local baselines help you reduce false warnings without weakening visibility into genuine service problems.
Event Timelines Add Context
Scattered alerts make you rebuild the same incident across logs, devices, and dashboards. That slows decisions and increases the chance that your team will miss the first sign of a larger issue. A network monitoring alert becomes more useful when it appears beside the events that happened before and after it.
You can improve this by grouping activities around the same device, user, application, or time window. For example, a traffic spike, a failed login, and a configuration change may belong to one developing incident rather than three separate problems. Showing them in sequence helps you understand cause and effect faster. It also reduces duplicate investigations, improves handoffs, and gives your team a clearer rationale for escalating, monitoring, or closing the event.
Conclusion
Alert fatigue is not solved by muting every warning or adding another dashboard. You reduce it by ranking alerts according to business impact, assigning clear ownership, adapting thresholds to local activity, and connecting related events. Begin with a two-week review of your noisiest categories and compare their volume with confirmed incidents.
Then tune one rule group at a time. A useful network monitoring alert should help you decide quickly, not make you investigate the monitoring system itself. For your Iraq IT team, that change can create calmer on-call rotations and faster action when trouble is real.
FAQs
What causes monitoring alert fatigue?
It develops when duplicate, low-value, or unclear warnings make genuine incidents harder for your team to identify and prioritize.
Can Azure monitoring reduce alert noise?
Yes. Properly configured Azure services can group related activity and help you investigate connected events instead of isolated warnings.
How does phishing protection support monitoring?
Effective phishing protection connects unusual sign-ins, identity changes, endpoint behavior, and network activity into a clearer incident view.